
OK, let me stick my neck out here and make a bold statement — “The United States is winning v the WutangCurse.”
Preliminary reports may not seem to indicate that, but I am telling you we are winning.
There I said it. Now, allow me to marshal the proof.
From the beginning of the WutangCurse, I have been following the www.worldometers.info numbers in regard to the Coronavirus, what I call the WutangCurse.
You can find the numbers right here:
World O Meter Coronavirus Numbers
I pay particular attention to the Daily New Cases for the United States of America. Scroll down and find the table that shows how many Daily New Cases we have each day. Then, I click on “USA” and see the breakdown by states.
First conclusion: Most of the USA cases are in New York. [I go to another website to verify that most of the New York cases are in New York City and environs.]
Second conclusion: We are in the midst of fifty separate fights and the most important one currently is in New York State and, in particular, in New York City and environs.
At 17:57 GMT today, New York had 25,665 cases of the USA’s total of 49,665 cases.
Again, most of those cases are clustered in New York City and the surrounding counties.
So, how can you tell we are winning, Big Red Car?
I looked at the total number of cases and the curve is still going straight up. We have a total of almost 50,000 cases and the trajectory of total cases still looks exponential.
But, I checked the graph of Daily New Cases and it also is going up.
I have an eureka moment and ask myself — Is the rate of increase increasing, decreasing, staying the same?
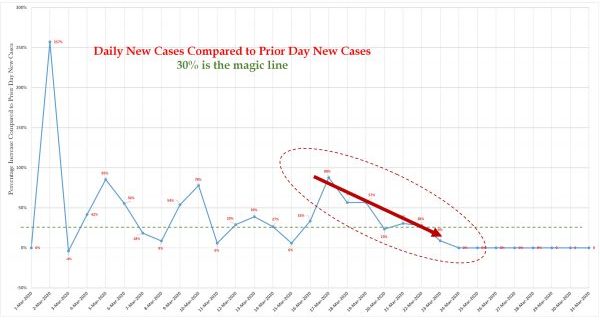
Then, I make this graph:
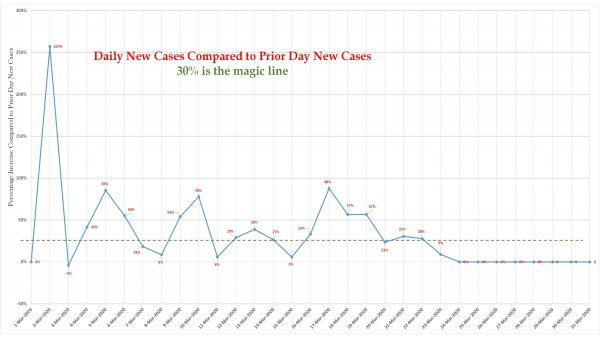
You will have to click on the graph to see it. You will notice that the rate of INCREASE of Daily New Cases has begun to decline. I can’t say if it is the BIG turn, but it is a leading indicator.
Why, Big Red Car?
It works like this, dear reader:
If, as, and when the rate of Daily New Cases declines, that will happen BEFORE the total number of cases goes down. Right?
Think it through, it has to. The total number of cases will only go down after the rate of increase of Daily New Cases declines. Eventually it will decline such that the total number of cases will also decline.
Total Cases @ beginning of day + Daily New Cases – Daily Recovered – Daily Deaths = Total Cases @ end of day
The rate of increase of Daily New Cases will begin to dampen — reduce in absolute terms — BEFORE it actually begins to decrease the total number of cases.
It looks to me like the daily increase in Daily New Cases has begun to decline. You agree?
I am not quite ready to scream it from the rooftops, but today — 24 March 2020 — Daily New Cases as of 17:57 GMT are 5,931 v a total of Daily New Cases for 23 March of 10,168.
We have eight more hours until 00:00 GMT, the gap will close, but we are doing fine.
In any event, the rate of increase is below the magic level of 30% which gives us 2X more cases every three days. The curve is going to flatten out.
In closing, let me say — NEW YORK and NEW YORK CITY is where the battle is being waged.
NY @ 17:57 GMT had a total of 25,665 total cases with 4,790 Daily New Cases.
New Jersey the #2 state, had a total of 3,675 total cases with 831 Daily New Cases.
Texas, the #11 state had a total of 826 cases with 20 Daily New Cases.
There you have it, dear readers. I think we are starting to win based on the declining rate of Daily New Cases in spite of the dire situation in New York.
Now, get down on your knees and say a quick prayer for the medical gear manufacturers, doctors, nurses, truck drivers, grocery shelf stockers, and all the people who are making the world work.
My Irish spider sense tells me we are just about to the crest and the waters will recede quickly. A guy named Noah told me that.